
26 Sept 2022. Excerpted from Ben Lonetree, Part 1.
- Vert Arbusto
- Sep 28, 2022
- 5 min read

For now we will leave speculation as to early Humans working with these natural vibrations. Let’s get on with exploring the theory that these vibrations can be amplified by certain Earth-related activity. To be precise … Geomagnetism.
I would like to add at this point that the Earth’s magnetic field was 20 times stronger in intensity in ancient times than it is today.
A year had passed and needed equipment to observe and measure the resonances was still in the design stage.
I had spent many hours hiking the Sedona outback with simple electronic equipment and a compass. At certain locations and for extended periods in time the compass would not detect Magnetic North. I thought I had located the suspected large deposit of Magnetite beneath the Earth’s surface. To my surprise in time the compass stabilized.
Ok … No deposit here as the compass would remain unable to find North if this were the case. Now I really had a dilemma on my hands! Whatever the source of this magnetic disturbance it was intermittent! My thoughts traveled back to the alleged Vortex Energy theory.
Could the magnetic source be Geomagnetic in origin? Months of research via the internet revealed a study by a certain US Geological group on the Earth’s Geodynamo.
A partial excerpt from this report reads …
Non-Dipole Field
That portion of the velocity field associated with the non-dipole magnetic field, which constitutes 10% of the earth's total magnetic field, fluctuates significantly over decade time scales apparantly reflecting the unsteady exchange of angular momentum between the core and the mantle. Initially at 1900, there are three major high-velocity zones: one in the northern hemisphere, one in the southern hemisphere, and one in the equatorial region.
By 1950, these three high-velocity zones have combined into single convulated structure, circumnavigating the CMB. Regardless of the high-velocity zone topology over the course of the 20th century, it appears that about 80% of the known Hotspots are distributed on or near these zones.
These graphics depict a rich behaviour of velocity patterns including shearing, rifting, Vortex motions, Upwelling and Downwelling.
To simplify the above report they are speaking of the Geodynamo within the Earth that produces the Earth’s magnetic field. The keywords in the report above are in bold print.
To explain Non-Dipole magnetics, as we know the Earth has a North and South Pole. What the report is saying is that certain locations on the planet have inward and outward flows of magnetism that are not polarized.
In other words, no North and South. Just pure magnetic energy. This would explain the action of my compass. If I were standing in an outflow of magnetic energy or inflow the compass would behave just as it did. When the outflow or inflow ceased things returned to normal and the compass once again pointed North.
To prove this theory took another year. Equipment was finished with the help of a friend in Australia. He had designed the necessary electronic equipment for observation of the resonances. Not an easy task. Our designs were similar and a few adjustments on my design proved to be the right combination for use here in the United States.
One nemesis researchers face is 60 Hz. power line noise. At low frequencies it interferes with sensitive equipment. Many people have speculated as to power line radiation propagating on a global basis, the same as a radio transmission. The answer is yes.
Below you will see a spectra sent to me from a friend in Italy. Italy and Europe use 50Hz. for power generation verses 60Hz. used here in the states. In the spectras we can see not only the very strong signature of 50Hz. in Italy but also 60Hz. after it traveled from the US to Italy. Easy to see why if you consider the miles upon miles of power lines we have strung across North America.
You have one massive antenna radiating 60Hz. into the atmosphere.
[Fig. 1]
The signature of 60Hz power line radiation originating from North America as seen in Italy is the fine thin line just above the brighter one at 50Hz I have observed the same thing in reverse. Europe’s power line radiation at 50 Hz is easily detected by my equipment here in the United States.
With the equipment for Schumann Resonance observation complete a plan was necessary. Observations of Schumann would be made at different locations around Arizona to see any special occurrences, particularly in Sedona. Below is a map indicating the different locations field research was conducted.
[Fig. 2]
Schumann Resonance was recorded at all the locations indicated on the map. An interesting thing about observing the resonances is you see them from two different perpectives. First you can observe the resonances as they occur on a global basis. The second is how they appear when influenced by near by lightning producing storms. Nearby can mean a storm in the immediate area or within several hundred miles.
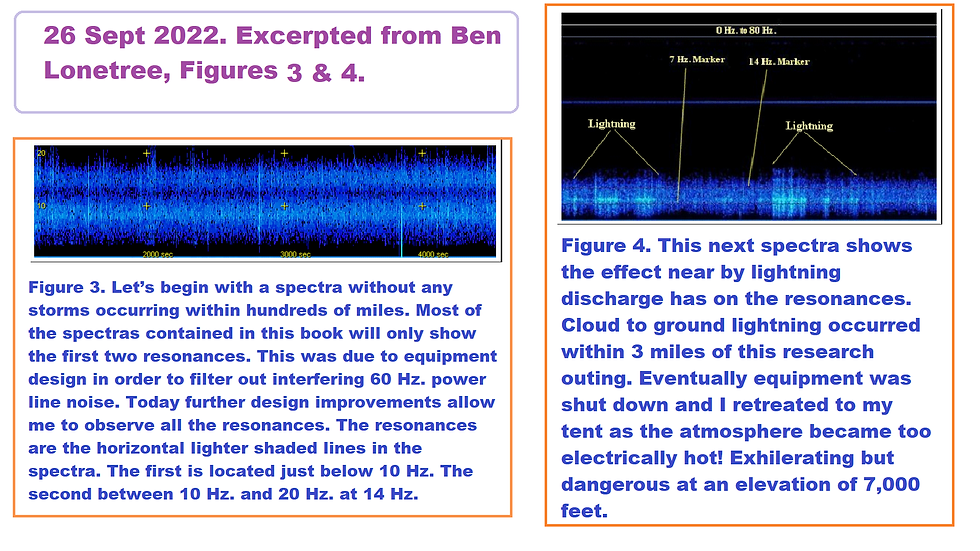
Let’s begin with a spectra without any storms occurring within hundreds of miles. Most of the spectras contained in this book will only show the first two resonances. This was due to equipment design in order to filter out interfering 60 Hz. power line noise. Today further design improvements allow me to observe all the resonances. The resonances are the horizontal lighter shaded lines in the spectra. The first is located just below 10 Hz. The second between 10 Hz. and 20 Hz. at 14 Hz.
[Fig. 3]
This next spectra shows the effect near by lightning discharge has on the resonances. Cloud to ground lightning occurred within 3 miles of this research outing. Eventually equipment was shut down and I retreated to my tent as the atmosphere became too electrically hot! Exhilerating but dangerous at an elevation of 7,000 feet.
[Fig. 4]
The brightening you see in the above spectra is lightning discharge. It is evident the first resonance is really getting its bell rung. The two red horizontal lines are marker frequencies. The thin blue line is noise from 60 Hz. power lines five miles away.
If you again look at the spectras it should be easy to see what I’ve explained as seeing Schumann on a global basis as well as locally. For the next several pages I have provided spectras from varying locations around Arizona so you can see what normal observations are like. By normal I mean a quiet atmosphere with no lightning activity.
These spectras will provide a point of reference when I discuss and demonstrate Geomagnetic affect on the first resonance. “Vortex Action”. The scale on the left of each line plot graph is amplitude or strength of Schumann. The scale at the bottom of each line plot graph, frequency. Please note the amplitude of Schumann at each location.
_
Speaking From Experience … Ben Lonetree
[ I maintain a web site devoted to Schumann Resonance. The address on the web is http:// www.electricterra.com (website no longer active).]
_
Source link: ( http://arizonaenergy.org/AirEnergy/SchumannAZ.htm )
_
Patreon: ( https://www.patreon.com/posts/72611325?pr=true )
wordpress: ( https://vertearbustosschumannresonanceharmonics.wordpress.com/2022/09/28/26-sept-2022-excerpted-from-ben-lonetree-part-1/ )
Comments